
BASICS OF VIBRATION FEATURE EXTRACTION
FEBRUARY 19, 2018 - BRIAN PHILLIPS, MECHANICAL ENGINEER
Many sources of data exist in the world of big data, not the least of which is vibration data.
The sources for vibration measurements include seismometers, accelerometers and microphones. They can measure vibrations ranging from infrasonic earthquakes to ultrasonic medical devices.
Despite different sources and frequency ranges, vibration signals are all processed via an analog-to-digital converter (ADC). This conversion gives digital representations of the signals, which can be processed to extract features.
What Is a Feature?
In the predictive analytics world, a feature is a measurable property or metric of the data that can be repeated as time passes. If the metric is non-repeatable, it has zero value and cannot be tracked as a function of time. As features are tracked over time, the machine or system’s general health status and useful life can be extrapolated.
Avoiding Pitfalls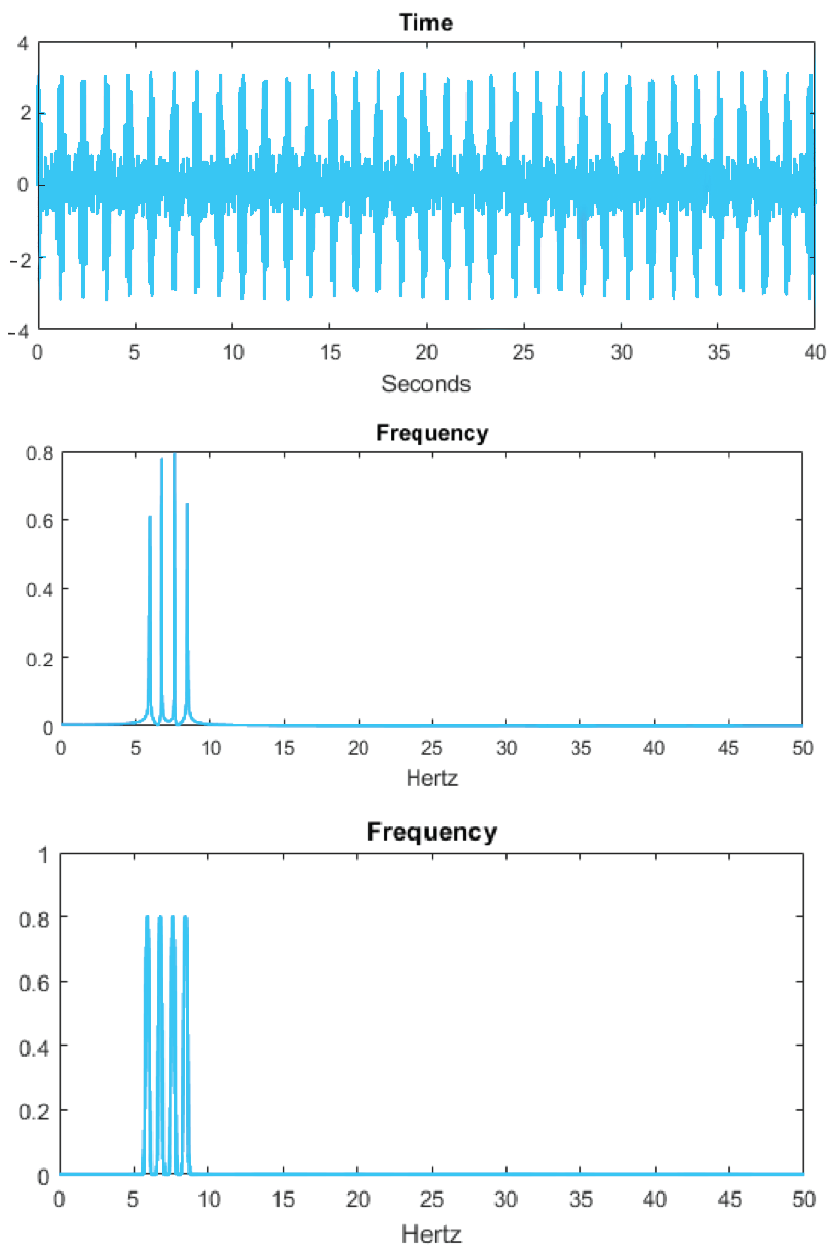
Vibration signals can be misleading if processed incorrectly. The signal on the right, for instance, appears to pulse every 1.2 to 1.3 seconds with some minor noise. How can one begin to extract features from that signal? Should the analysis attempt to track all these peaks? What if the start time were to be accidentally offset?
Vibration signals should normally be analyzed in the frequency domain. When converted, the aforementioned signal shows that it is actually a simple combination of four much higher frequency signals.
Therefore, rather than attempting to track dozens or even hundreds of peaks as features, a simple four features can be taken from the signal. However, one must be careful – the signal is not yet processed enough to discover the magnitude of these frequencies. By applying digital signal processing techniques, the frequency domain representation of the signal is further clarified.
In this example, all four frequencies have the same magnitude. Knowing this, users can track the magnitude of the four frequencies, or features, to see how they change as the health of their machine degrades.
Proper processing of a vibration signal simplifies complex systems, allowing engineers and data scientists to quickly and easily make decisions about features that indicate machine health.
Noise Kills
One major issue that plagues vibration measurements is noise. Noise can usually be mitigated, although not eliminated, by properly setting up the measurement environment. Still, some noise will always remain, whether it stems from irrelevant mechanical connections to the test system or an electrical interaction.
Other noise sources include transient events like someone walking by the measurement piece. These events can commonly be averaged out of a vibration signal by converting into the frequency domain, even if the magnitude of the noise is so large that it apparently drowns out the entire signal, as shown below.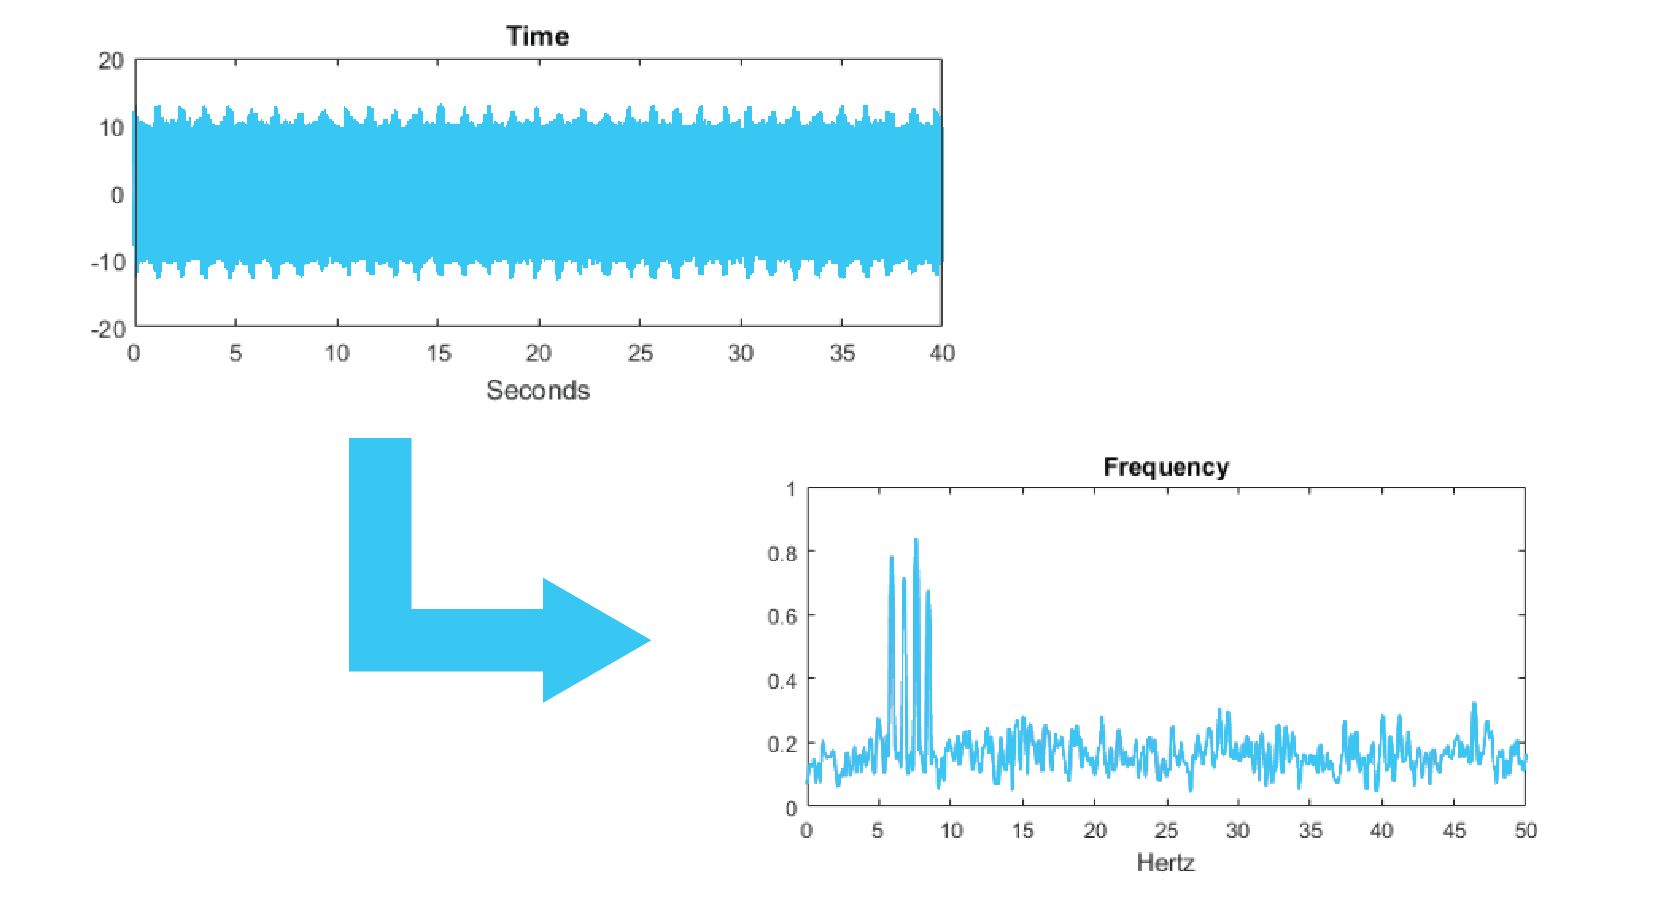
While noise can and will harm measurements, poor quality vibration signals can generally be de-noised enough to still extract the features of interest.
How Do I Leverage This?
Features can be used to track machine health, predict remaining useful life and prevent impending failures.
Internal combustion engines, for example, generate a characteristic echo in the signal when they begin to misfire. This echo could be used as a feature to detect poor performance in internal combustion engines.
Software designed to analyze features can alert key personnel when it detects one or more machines leaving normal limits. This could indicate that the machine is beginning to fail, enabling personnel to perform maintenance or replace parts before a failure occurs.
A Wide World of Data
Vibration data can be used to detect and predict potential failures on almost any mechanical system. It has been used on systems including aircrafts, wind turbines, cars, pumps, industrial machines and bridges.
What If I Don't Have a Vibration Specialist?
Several software suites that analyze and process raw vibration signals and extract features are available on the market. Data scientists can use the features they generate to assess machine health and prevent failures.
Predictronics offers its own software. PDX, an end-to-end predictive analytics solution, enables users to reduce unplanned downtime, increase productivity and improve product quality by collecting and analyzing big data.

About the Author
Brian Phillips is a Mechanical Engineer for Predictronics Corp. with 4+ years of experience in software design and development, vibrating and rotating systems, fault detection algorithms and frequency domain analysis. Brian is the sole developer and project lead for Predictronics’ PDX DAQ, an application that allows users to synchronize data collection from multiple sources for any given period of time. Brian has a Bachelor of Science in Mechanical Engineering from the University of Cincinnati, where he studied intelligence maintenance systems at the NSF I/UCRC IMS Center founded by Professor Jay Lee. Connect with him on LinkedIn.
For more information and weekly updates, follow Predictronics: